Details
You may view the process model in detail by double-clicking a process instance.
In the detail dialog, you can investigate which steps the process has performed.
You can also inspect the data processed by this process instance.
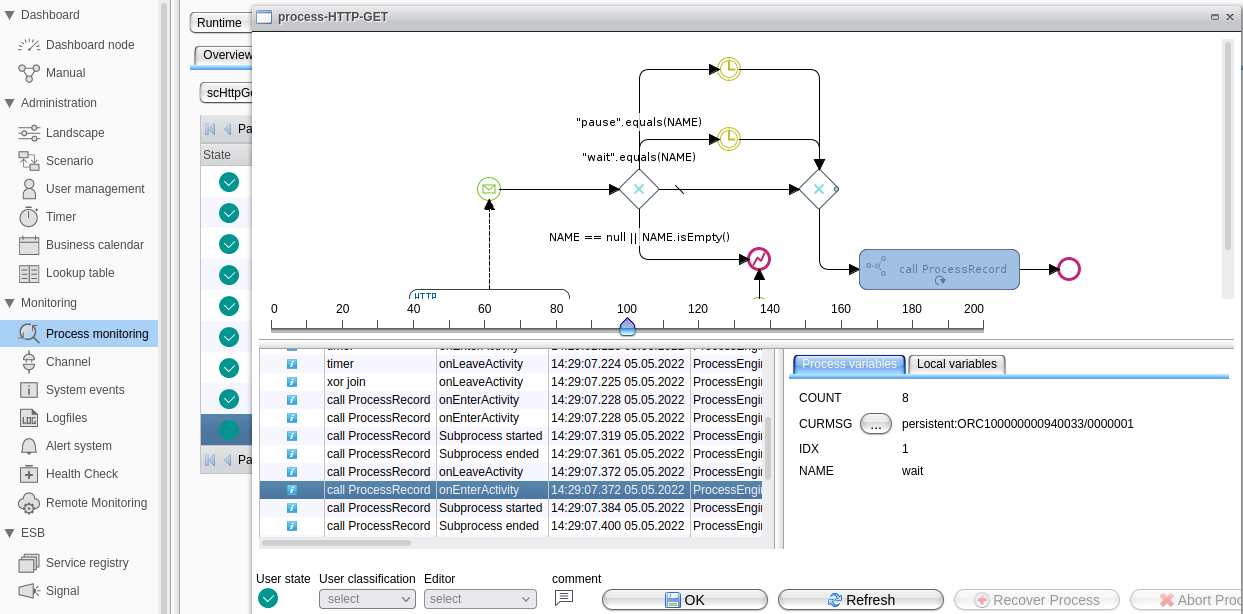
In the upper area, the process model graph is displayed. In the lower area, the executed process steps are listed.
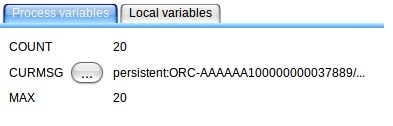
When a process step is selected, the panel to the right shows all corresponding variables and their content.
For variables containing a message, clicking on the button with the three dots (...) will display this message.
Provided that you have the role Change.process.user.state, you will be able to change the User state, User classification, and Editor. You may also assign a comment to the process instance.
Display Call Hierarchy of Process Instances
Process monitoring supports an optional view of the call hierarchy of processes, which can be displayed alongside the processed data view. To access this, open the context menu of a process by right-clicking on it and select the entry Show process tree.
This will open the following view:
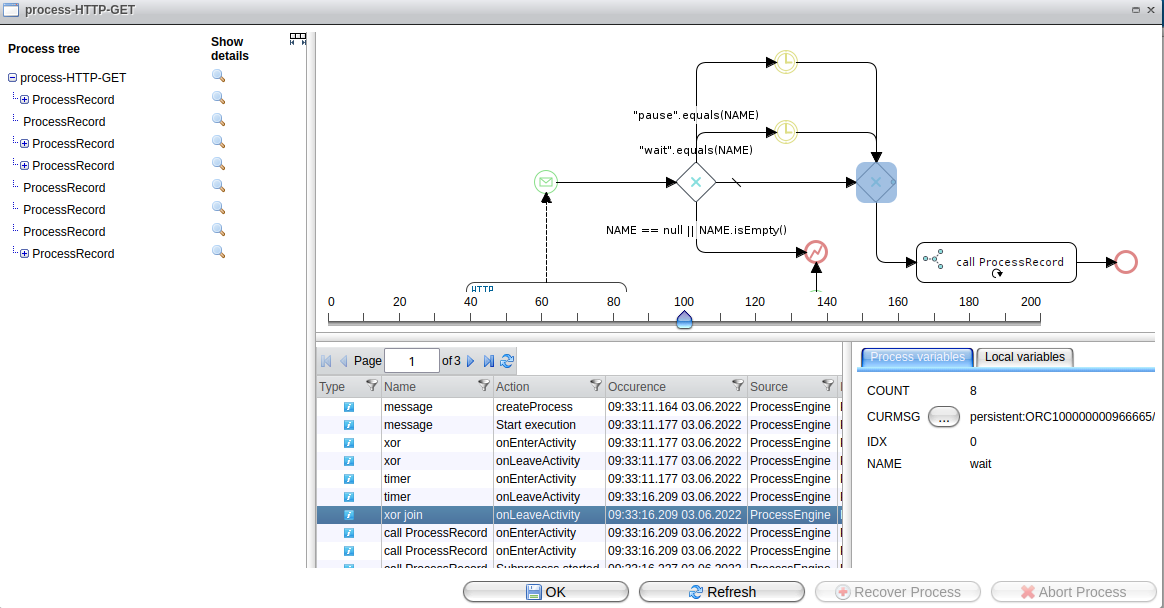
In the left panel, you can see the selected process and all its derived processes presented in a tree structure. Clicking the magnifier next to a process will display its details in the right panel.
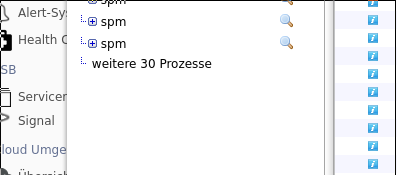
Please note that the number of subprocesses displayed is limited to 20. If your parent process has more than 20 child processes, the list of child processes will be truncated, and a brief message will be displayed instead.